Topics and Documents
So far, the following topics are included in this repository:
- image processing
- data visualization
Image Processing
The document picture_format.ipynb illustrates the following procedures:
- how to generate images with numpy arrays
- how to save them in .png format
- how to load and convert them to Python lists
- how to save them in .csv files
- how to read them as pandas dataframes
Here an example of images generated in this document (digits in this case):

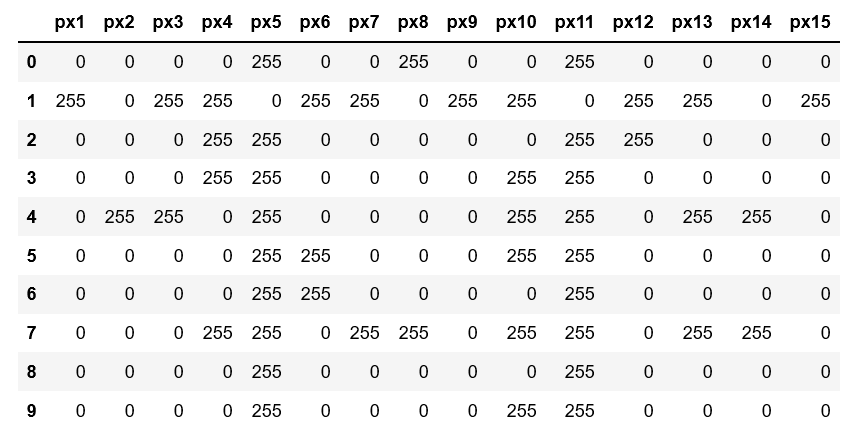
Here an example of the data content of these images in table format (px stands for pixel):
The code documentation in this document is in German.
Data Visualization
The document basic_data_visualization_math.ipynb illustrates the following procedures:
- how to generate data using mathematical functions
- how to plot this data using matplotlib
- how to change default plotting options and obtain customized plotting results
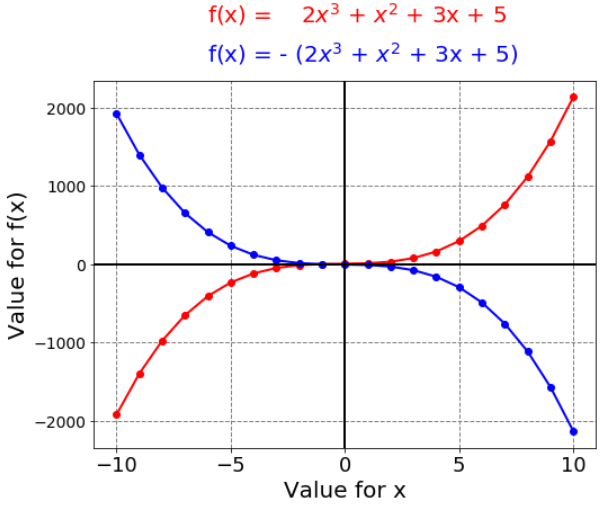
Here an example of plotted mathematical functions:
The document basic_data_visualization_iris.ipynb is meant to visualize multidimensional data. Here, the classical Iris data set is used. This document illustrates the following procedures:
- how to generate a pandas dataframe with data downloaded from a repository
- how to generate different types of plots such as scatter plots, histograms, KDE-plots or boxplots
- how to use alternative libraries (e.g. seaborn, numpy or scipy) and alternative methods for data visualization tasks
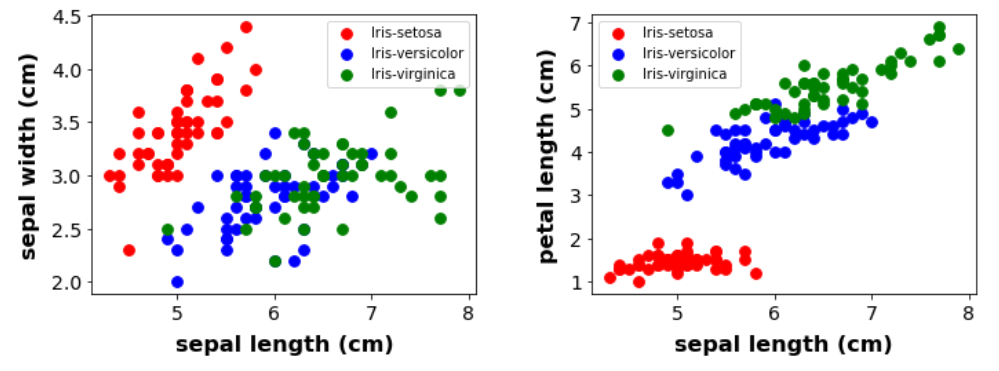
Here some examples: